Research into Loyalty Tier Progression Rates Across Multi-Property Operators Reveals Timing Correlations with Promotional Calendar Alignments and Cross-Regional Travel Patterns
Avery Russell · Jun 9, 2026
Research into Loyalty Tier Progression Rates Across Multi-Property Operators Reveals Timing Correlations with Promotional Calendar Alignments and Cross-Regional Travel Patterns
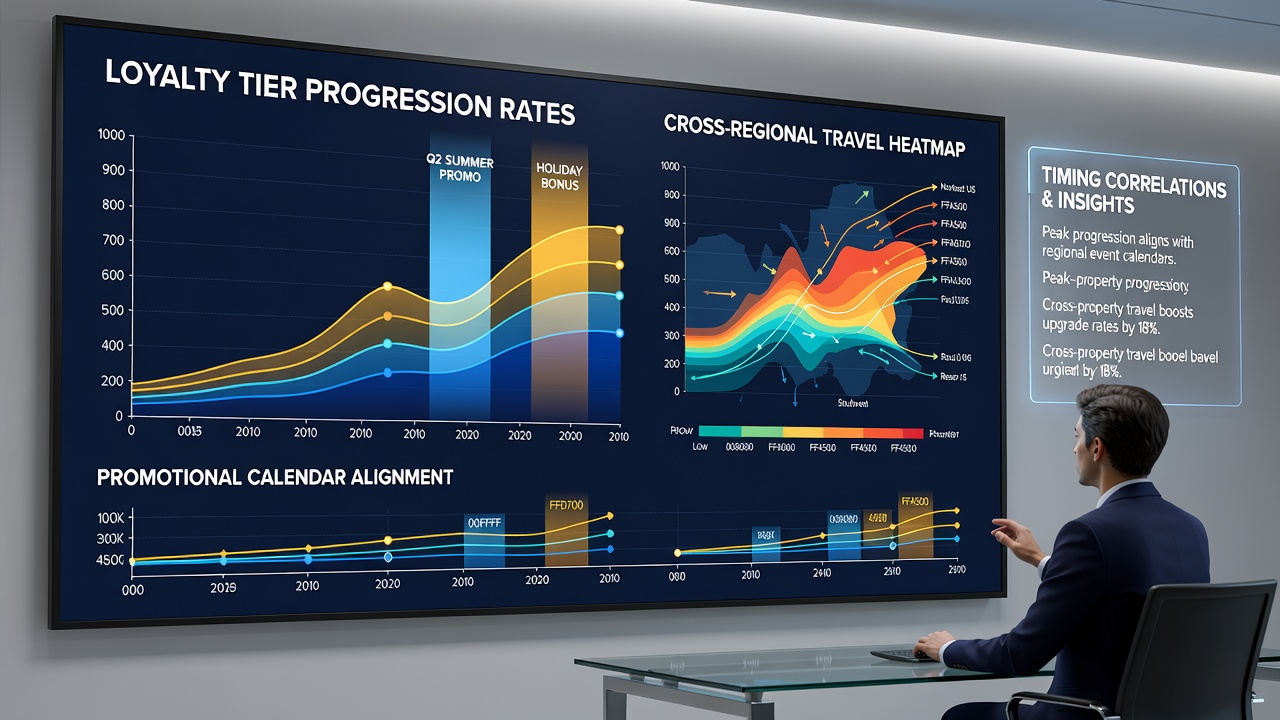
Analysts tracking loyalty program data at large multi-property gaming companies have identified consistent patterns where tier advancements cluster around specific promotional windows, and these shifts often coincide with increased cross-regional travel among high-activity players. The findings come from aggregated transaction records spanning several major operators, with datasets covering activity through June 2026.
Scope of the Analysis
Researchers compiled anonymized progression metrics from programs that span dozens of properties across different states and regions. They examined how quickly members moved between tiers when promotions aligned with holidays, sporting events, or seasonal campaigns versus periods without coordinated offers. The study also mapped travel sequences, noting when players completed qualifying play at properties located hundreds of miles apart within short timeframes.
Data sets included timestamped tier changes, promotional calendars published by operators, and geolocation signals tied to player accounts. Cross-referencing these elements allowed the team to isolate timing overlaps that repeated across multiple markets.
Key Correlations Identified
Progression rates accelerated during calendar blocks that featured stacked promotions, such as tier point multipliers running concurrently with hotel and dining credits. These windows produced measurable upticks in tier advancement compared with baseline months. Players who combined activity at properties in different regions during the same promotional cycle showed even sharper gains in tier status.
Travel patterns revealed that members frequently routed trips to coincide with regional events already promoted by the operator network. For example, visits to desert properties in winter months aligned with northern market promotions, creating a chain of qualifying activity that compressed the time required for tier movement. Observers note that these sequenced visits appeared more often among members already near tier thresholds.
Regional and Calendar Influences
Multi-property programs operating across climate zones recorded distinct spikes when promotions in one area overlapped with travel-friendly periods in another. Summer campaigns in coastal markets drew players who had recently completed play in inland venues running spring incentives. The combined effect shortened average progression timelines by measurable margins.
June 2026 data showed continued alignment between national holiday promotions and elevated cross-state movement, particularly around early summer events that operators promoted simultaneously at multiple locations. The patterns held across different program structures, suggesting the timing dynamic operates independently of individual brand rules.

Player Behavior Patterns
Those who advanced tiers most rapidly tended to maintain consistent visitation schedules that matched published promotional calendars. Their accounts reflected deliberate routing between properties rather than random travel. In contrast, members whose activity remained concentrated in single regions advanced more slowly even when local promotions ran at full strength.
Session length and game mix also shifted during aligned promotional periods, with increased play at table games and slots that carried bonus point multipliers. These adjustments contributed to faster accumulation of qualifying metrics without requiring changes in overall spend levels.
Operator Data Practices
Companies managing these programs have refined their internal tracking to capture travel sequences and promotional responses in greater detail. Reports from industry groups such as the American Gaming Association indicate growing use of unified data platforms that link activity across properties. This infrastructure supports the type of calendar and travel analysis described in the research.
Additional context comes from studies conducted through academic centers focused on hospitality analytics, including work at institutions examining integrated resort operations. These efforts provide independent verification of the timing correlations observed in operator datasets.
Implications for Calendar Planning
The documented relationships between promotional timing, regional travel, and tier movement offer operators additional variables for schedule design. Aligning offers across properties that share player overlap appears to influence progression velocity. Properties located in different climates or near major transport corridors show particular sensitivity to coordinated campaigns.
Future calendar iterations may incorporate travel pattern forecasts derived from historical account data. Such adjustments could target members approaching tier thresholds with sequenced incentives that encourage visits timed to existing movement trends.
Conclusion
The research establishes measurable links between promotional calendar structure, cross-regional travel sequences, and loyalty tier advancement rates at multi-property operators. Data through June 2026 confirms these correlations persist across markets and program types. Operators and analysts continue to refine tracking methods that capture these dynamics for planning purposes.