Inside Progressive Jackpot Contribution Rates: How They Alter Slot Machine Return Profiles Over Time
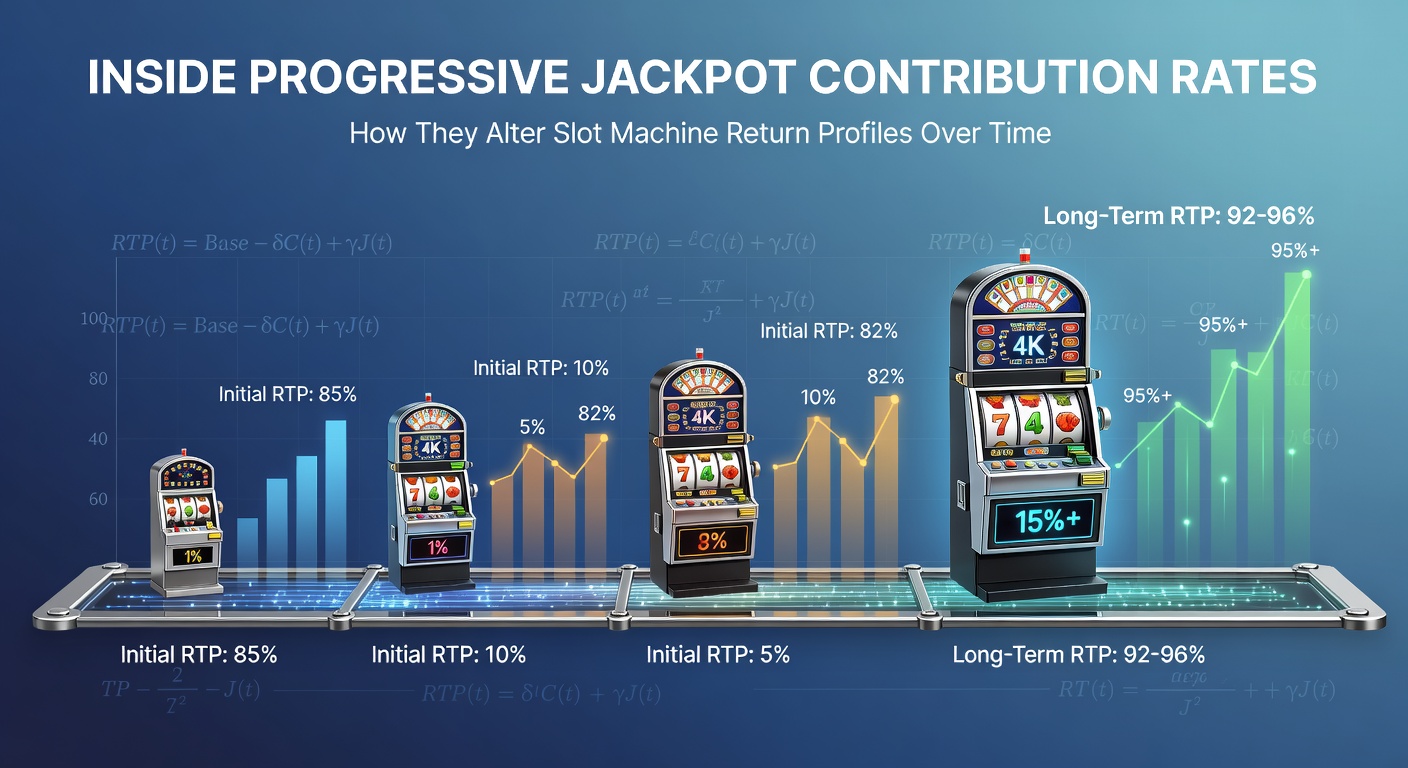
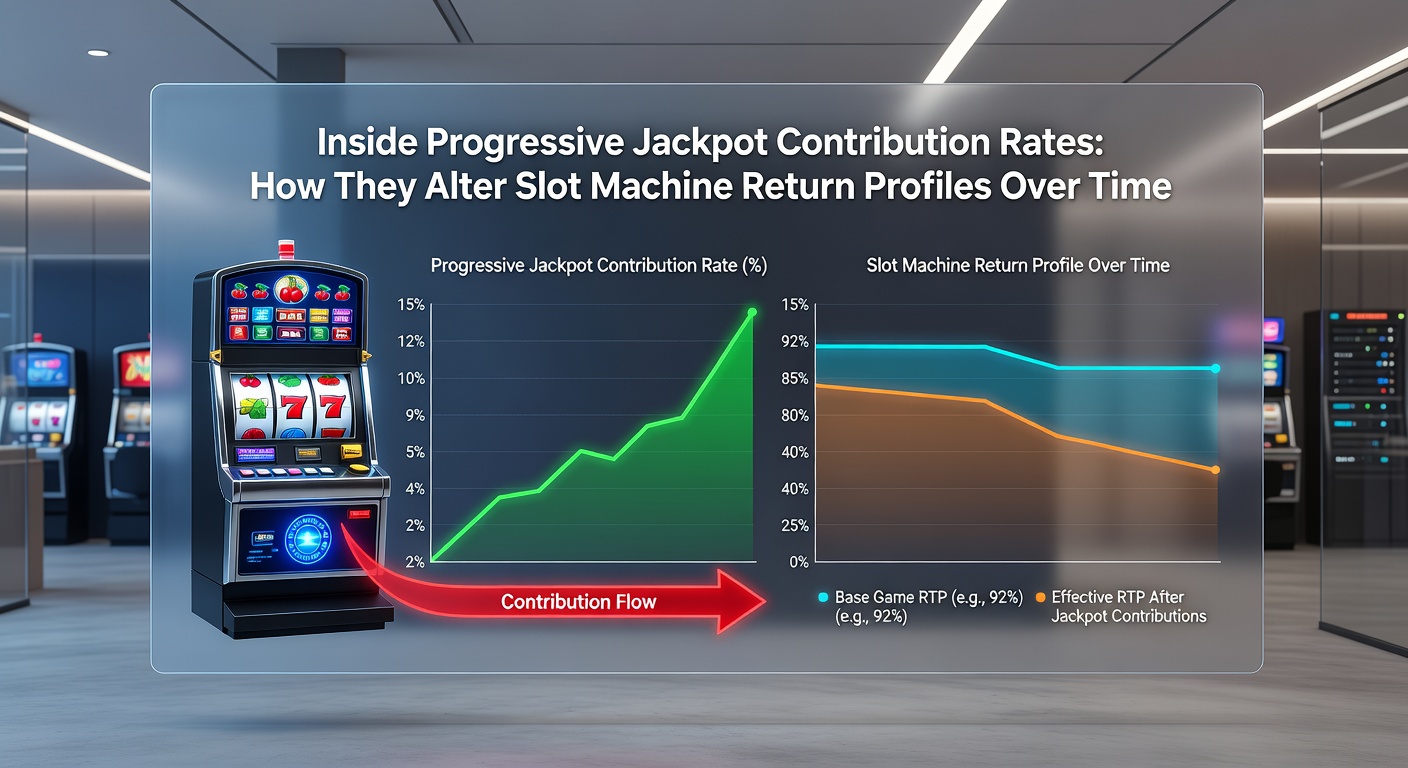
Progressive jackpot slots operate through a mechanism where a fixed percentage of each wager feeds into a growing prize pool, and this contribution rate directly shapes the machine's long-term return profile. Operators set these rates typically between one and five percent of bets, which reduces the base return to player percentage compared to non-progressive counterparts while the jackpot accumulates over successive plays.
Mechanics of Contribution Rates in Progressive Systems
Each bet on a linked progressive machine allocates a portion to the jackpot, and this allocation occurs before any other payout calculations take effect. Data from regulatory filings shows that machines in multi-casino networks often maintain higher contribution rates than standalone units because the shared pool grows faster and attracts more play volume. Over extended periods the cumulative effect compounds as the jackpot meter climbs, which shifts the overall return distribution since larger portions of the theoretical payout sit in the top prize rather than in smaller frequent wins.
Analysts track these shifts through session data aggregated across thousands of spins, revealing that contribution rates remain constant even as the jackpot size changes yet the probability-weighted return evolves. When the jackpot reaches certain thresholds the expected value calculation incorporates both the base game RTP and the chance of hitting the progressive prize, creating a dynamic profile that favors longer play sessions in some configurations.
Long-Term Alterations to Return Profiles
Return profiles on progressive slots diverge from standard machines because the contribution rate locks away a segment of every wager indefinitely until a jackpot triggers. Studies conducted by independent testing labs indicate that this locked segment creates a gradual decline in the realized RTP during periods when the jackpot stays below its reset value, whereas a hit resets the meter and restarts the cycle with fresh contribution inflows. Observers note that networks spanning multiple jurisdictions experience synchronized rate adjustments when regulatory bodies update technical standards, which occurred in several North American markets during early 2026 reviews.
In May 2026 industry reports highlighted new slot deployments where operators adjusted contribution parameters on wide-area progressives to align with updated compliance requirements from the Nevada Gaming Control Board. These adjustments altered the speed at which return profiles shifted, particularly on machines with base RTP figures near ninety-four percent before contributions.
Regional Data and Network Variations
Figures released by the Nevada Gaming Control Board demonstrate that contribution rates on linked progressives averaged 2.8 percent across monitored properties in the prior fiscal year, producing measurable differences in session-level returns compared to local progressives set at 1.9 percent. Similar patterns appear in Australian market analyses where state-level oversight tracks how contribution allocations influence overall hold percentages on video slots. Those datasets reveal that machines with higher rates exhibit flatter return curves in the short term yet steeper upward spikes once jackpots exceed median trigger thresholds.
Network operators manage these profiles through backend software that logs every contribution increment, allowing precise modeling of expected returns over millions of spins. Research from academic sources such as the Griffith University Centre for Gambling Education examines how rate variations across linked machines affect player session durations, showing that elevated contributions correlate with extended play before a jackpot reset occurs.
Factors Influencing Profile Changes Over Time
Jackpot reset values, network size, and game volatility interact with the fixed contribution rate to reshape return trajectories. Larger networks distribute contributions across more machines, accelerating meter growth and thereby advancing the point at which the progressive component begins to offset the initial RTP reduction. Technical specifications require that contribution percentages stay within certified bounds, yet operators retain flexibility to reallocate portions between different jackpot tiers, which modifies the timing of profile shifts without altering the overall rate.
Simulation models used by testing agencies account for these variables when certifying new titles, and the resulting reports indicate that return profiles stabilize only after the jackpot has cycled through multiple resets. Data collected during 2025 and into 2026 shows consistent patterns where machines with contribution rates above three percent required longer average sessions to reach their theoretical RTP ceiling once the progressive element activated.
Conclusion
Contribution rates embedded in progressive jackpot systems create measurable, time-dependent changes to slot machine return profiles through steady allocation of wagers into growing prize pools. Regulatory data and independent analyses confirm that these rates produce distinct return trajectories compared to non-progressive games, with network scale and reset mechanics determining how quickly profiles evolve. Ongoing monitoring by bodies such as the Nevada Gaming Control Board continues to document these dynamics across operational environments.