Examining How Loyalty Point Redemption Options Influence Repeat Visits to Regional Gaming Facilities
Tina Carter · Aug 14, 2026
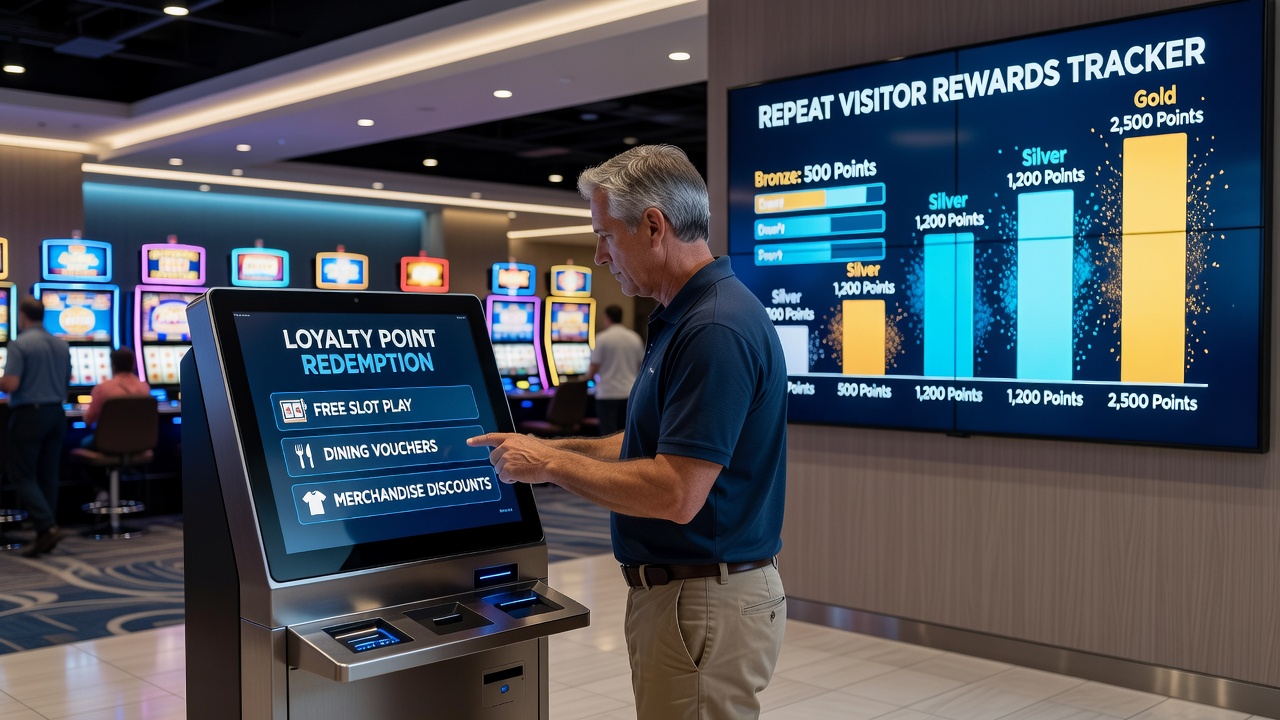
Examining How Loyalty Point Redemption Options Influence Repeat Visits to Regional Gaming Facilities
Regional gaming facilities across the United States have expanded loyalty programs in recent years, with point redemption choices playing a central role in shaping how often patrons return. Operators in markets from Pennsylvania to Illinois track redemption data closely because these systems directly tie player activity to measurable visit frequency. Research from state regulatory bodies shows that facilities offering multiple redemption paths, such as dining credits, hotel stays, merchandise, and free play, often record higher repeat visitation rates than those limited to fewer options.
Redemption Categories and Their Measurable Effects
Data collected by the Pennsylvania Gaming Control Board indicates that players who redeem points for experiential rewards like meals or entertainment return within 30 days at rates 18 percent higher than those who convert points solely into free play credits. Similar patterns appear in reports from the Illinois Gaming Board, where integrated resort properties that bundle redemption into packages report steadier monthly foot traffic. Observers note that convenience matters, since programs allowing instant mobile redemptions reduce friction and encourage smaller but more frequent visits throughout a month.
Facilities in secondary markets face different competitive pressures than destination casinos, so loyalty structures adapt accordingly. Regional operators often emphasize everyday redemptions such as gas station vouchers or local retail credits because these align with shorter drive times and routine spending habits. One study released in early 2026 by researchers at the University of Nevada, Reno found that players living within 50 miles of a regional property increased their average monthly visits by 1.4 when dining redemptions carried no blackout dates.
Regional Market Variations in August 2026
By August 2026 several Mid-Atlantic and Midwest properties had updated their loyalty interfaces to include tiered redemption multipliers during slower weekdays. These changes coincided with updated reporting from the New Jersey Division of Gaming Enforcement, which tracked a 12 percent rise in repeat visits among carded players who used flexible point values for both gaming and non-gaming amenities. Operators in Ohio and Indiana meanwhile introduced point pooling across sister properties, allowing accumulated balances to transfer and thereby supporting cross-market travel patterns that boost overall visitation counts.
What's notable is how redemption value perception influences behavior. Programs that publish clear point-to-dollar conversion rates see steadier engagement because players understand exactly what each visit earns. In contrast, opaque systems that hide expiration rules or require manager approval tend to correlate with longer gaps between trips, according to aggregated player tracking summaries shared at industry conferences.
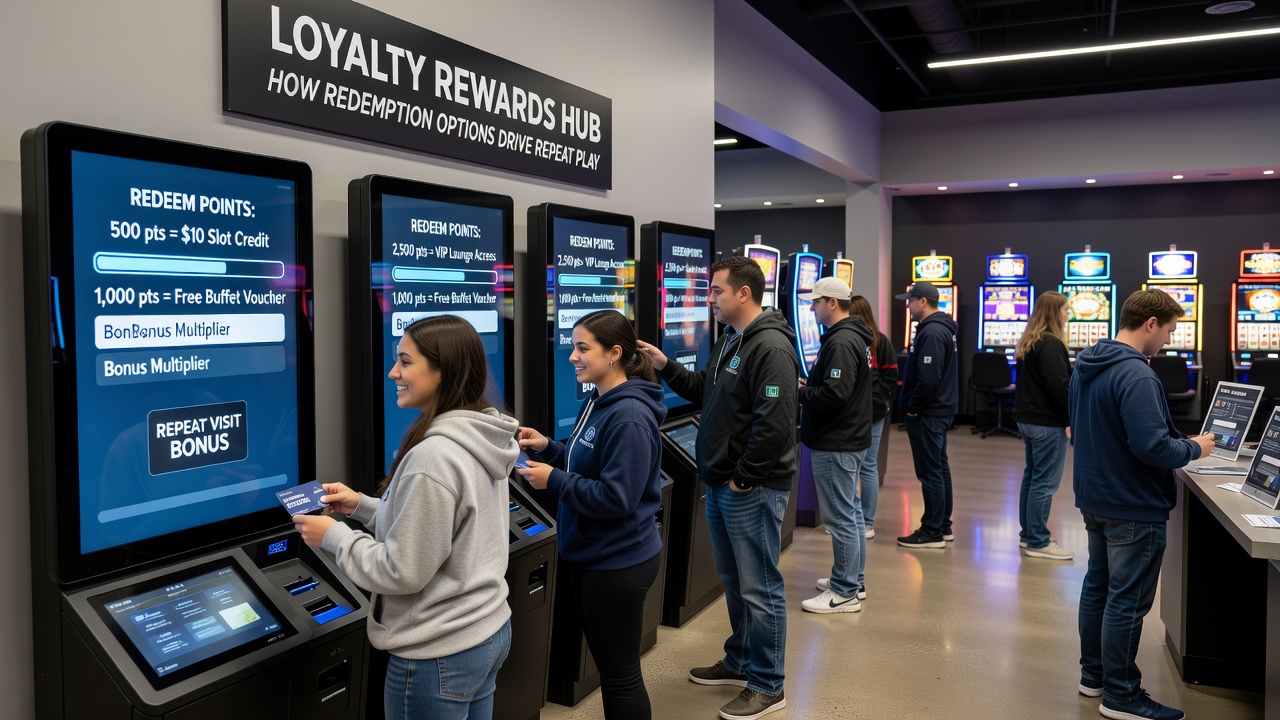
Data Patterns Across Multiple Jurisdictions
Longitudinal analysis from the Australian Gambling Research Centre provides a useful comparison, showing that loyalty members who redeem for a mix of cash-back and non-gaming rewards maintain higher annual visit totals than those restricted to slot credits alone. While the regulatory environment differs, the underlying behavioral data aligns with findings from U.S. state commissions. Facilities that diversify redemption menus report lower player churn, particularly among mid-tier loyalty members who represent the largest segment of repeat regional traffic.
Take one property group operating three locations in upstate New York that adjusted its program in 2025 to include instant hotel and spa redemptions. Internal metrics shared with regulators later showed a measurable uptick in consecutive-day visits during promotional periods. Those who've studied similar adjustments across multiple markets point out that redemption speed and perceived fairness matter more than the absolute dollar value offered.
Operational Factors That Shape Outcomes
Player tracking systems at regional facilities capture granular data on redemption timing and its link to subsequent play sessions. When points convert quickly at the point of sale or through kiosk transactions, session lengths and return intervals shorten in predictable ways. Properties that integrate these systems with mobile apps further reduce barriers, allowing players to check balances and complete redemptions without leaving the gaming floor. Evidence from multiple state reports suggests that seamless digital redemption correlates with higher carded play percentages, which in turn supplies operators with richer behavioral datasets for future program refinements.
Regional operators also monitor external factors such as fuel prices and local employment trends because these affect disposable income and willingness to travel for redemptions. Programs that adjust point thresholds seasonally demonstrate more stable year-round visitation than static systems. The reality is that redemption options function as one lever among several, yet data consistently shows they exert measurable influence on how frequently regional patrons choose one facility over competitors.
Conclusion
Loyalty point redemption options continue to serve as a primary mechanism through which regional gaming facilities influence repeat visitation patterns. State-level data and cross-jurisdictional studies confirm that variety, transparency, and ease of use drive measurable differences in return frequency. As operators refine these programs through 2026 and beyond, tracking redemption behaviors alongside visit metrics remains central to understanding player loyalty dynamics across diverse regional markets.