Analyzing Data from Integrated Casino Systems on Cross-Game Transition Frequencies During Peak Hours
Zara Vogel · Jun 28, 2026

Analyzing Data from Integrated Casino Systems on Cross-Game Transition Frequencies During Peak Hours
Integrated casino systems collect extensive player movement records through loyalty programs, RFID table monitoring, and digital slot interfaces, and these records allow operators to map how guests shift between game categories when visitor volumes reach their highest levels. Data analysts examine timestamps from card swipes, machine logins, and dealer reports to calculate transition frequencies across slots, table games, poker rooms, and sportsbooks during periods that typically run from early evening through late night.
Core Components of Integrated Tracking Platforms
Modern platforms combine multiple data streams into unified databases where each player action receives a precise time stamp and location code, and this structure supports queries that isolate peak-hour segments for detailed review. Systems deployed across major properties in Nevada and Macau feed information into central servers that flag movements such as a guest leaving a slot bank and entering a blackjack pit within a set interval. Analysts then aggregate these events to produce frequency counts that reveal dominant pathways rather than isolated incidents.
Peak-Hour Windows and Data Segmentation
Operators define peak intervals through historical footfall metrics, and June 2026 reports from several large resorts showed consistent spikes between 7:00 p.m. and 11:00 p.m. on weekdays with extended tails on weekends. During these windows the systems record elevated transition rates, particularly from electronic gaming devices toward live table games and vice versa, while sports betting terminals experience inflows from both categories when major events coincide with the same timeframe. Segmentation routines split the data by hour, day type, and player tier so that frequency calculations remain comparable across properties of different sizes.
Observed Transition Patterns in Aggregated Datasets
Studies of multi-property datasets indicate that roughly 38 percent of tracked players initiate at least one cross-category move during a single peak session, and the most common sequence involves slots to table games within a 12-minute window. Secondary patterns show table-game participants returning to slot banks after shorter sojourns, often when table minimums increase or when nearby machines display progressive jackpots that exceed a predetermined threshold. Poker room entries occur at lower overall frequencies yet display steadier inflows from both slots and table games during tournament start times that overlap with evening peaks.
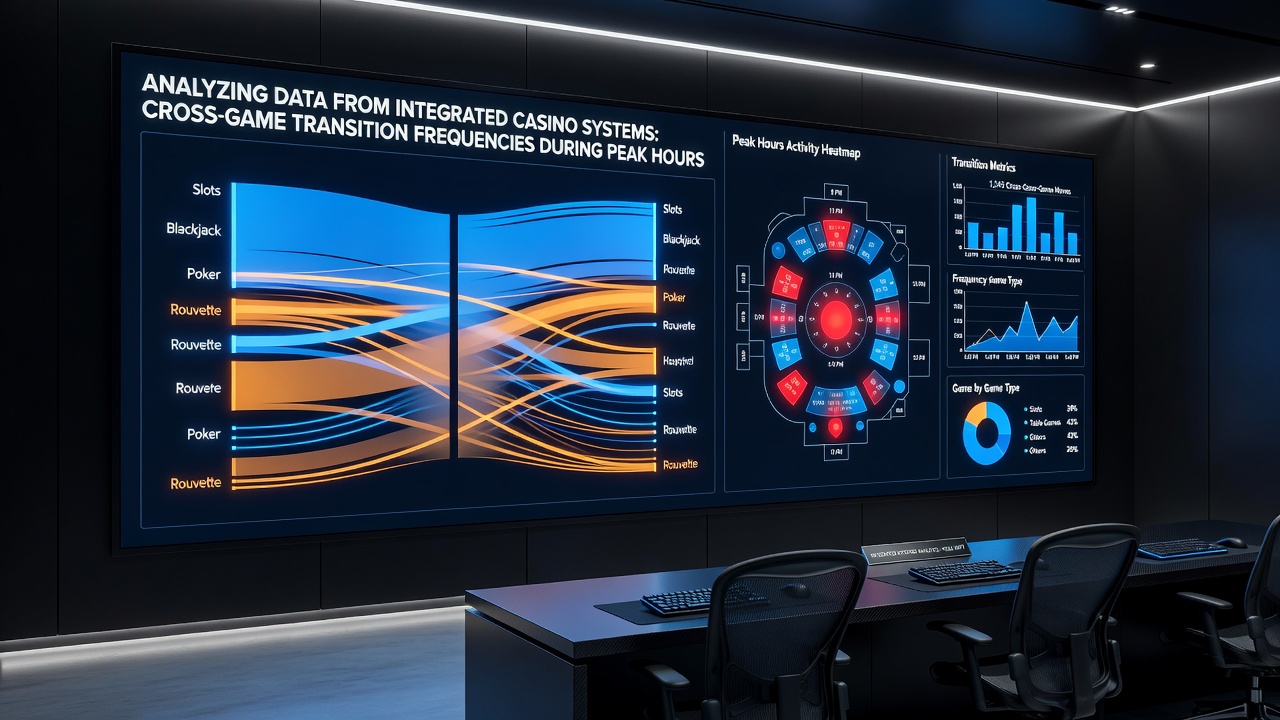
Geographic variation appears when data from U.S. and Asian markets receive side-by-side comparison. Properties operating under the Nevada Gaming Control Board guidelines record higher slot-to-table transitions, whereas integrated resorts in Singapore and Australia show stronger table-to-sportsbook movements once evening horse and football schedules align with local peak hours. These differences trace back to regulatory floor layouts and the density of each game type rather than to any single algorithmic factor.
Methodologies for Frequency Calculation
Analysts apply survival models and Markov chain techniques to the timestamped logs so that transition probabilities can be estimated for successive game categories. Each model incorporates covariates such as player loyalty tier, time since last visit, and concurrent promotional offers that may influence movement decisions. Validation steps compare model outputs against manual observation samples collected on the casino floor during the same June 2026 observation periods, and the resulting error margins remain below 6 percent for the dominant transition pairs.
External Research Inputs
University-led projects supplement operator data with controlled experiments that simulate peak crowding conditions. One collaborative effort coordinated by the University of Nevada, Las Vegas examined anonymized transition logs from three Strip properties and confirmed that average dwell time at the origin game drops by 14 minutes once a transition occurs. A parallel study released by the Australian Gambling Research Centre analyzed similar logs from New South Wales venues and reported comparable reductions in dwell time alongside an increase in total games played per visit when transitions exceed two per session.
Operational Adjustments Derived from Transition Data
Once frequency tables are finalized, floor managers adjust staffing rosters and machine groupings to accommodate the documented flows. High-transition corridors receive additional signage and host presence, while game categories that lose participants rapidly see revised minimum bet structures or added progressive features intended to extend session length. These adjustments rely on the same integrated systems that supplied the original measurements, creating a closed feedback loop that updates nightly during ongoing peak periods.
Conclusion
Integrated casino systems continue to supply granular records that quantify cross-game transition frequencies during peak hours, and the resulting datasets inform both immediate floor decisions and longer-term capital planning. Continued refinement of segmentation methods and external academic validation ensures that frequency statistics remain reliable across jurisdictions and market conditions through 2026 and beyond.